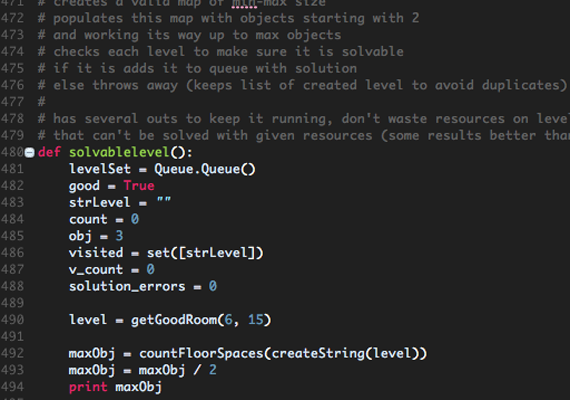
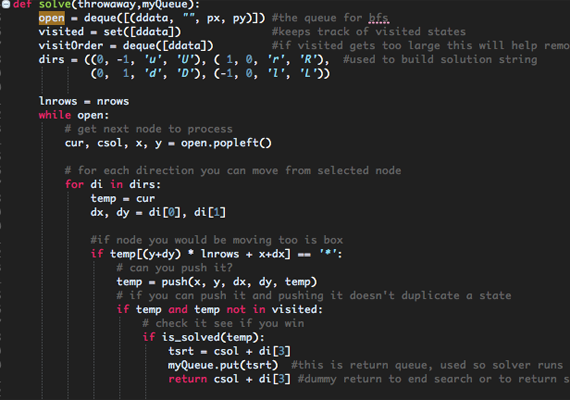
Python code to generate a map and find possible levels using that map. Runs traditional ranking procedures on each level and adds them to a file to be parsed and added to database.
Read More
Levels Created
Levels in Database
Levels Played
Strategy
don't want to read code, here is an overview of what is happening
1. Start with empty map
A random sized map, height and width, is chosen from supplied minimum and maximum values. That map is sent to be filled with floor and wall tiles. A series of 17, 5x5 templates are used to generate interesting maps.
2. Use templates to add Floors and Walls
The templates consists of 3x3 inner block surrounded by 'ghost' tiles. All tiles consists of either floors or walls. The ghost tiles aren't applied to the map but are used to make sure the templates line up in a usable way. Each template is laid down with its ghost tiles overlapping the inner block tiles of previous chosen templates. Any overlapping tiles must be of the same type or the template is rejected and a new one is tried until a suitable template is applied.
This is repeated until the entire map is made of walls and floors spaces. A boarder of wall tiles is added to the map to help users recognize level boundaries.
3. Test for good room
Once a map is generated it needs to be tested to ensure it will produce interesting and solvable levels. This is just a pruning step to ensure CPU time is not wasted on levels that will be thrown out.
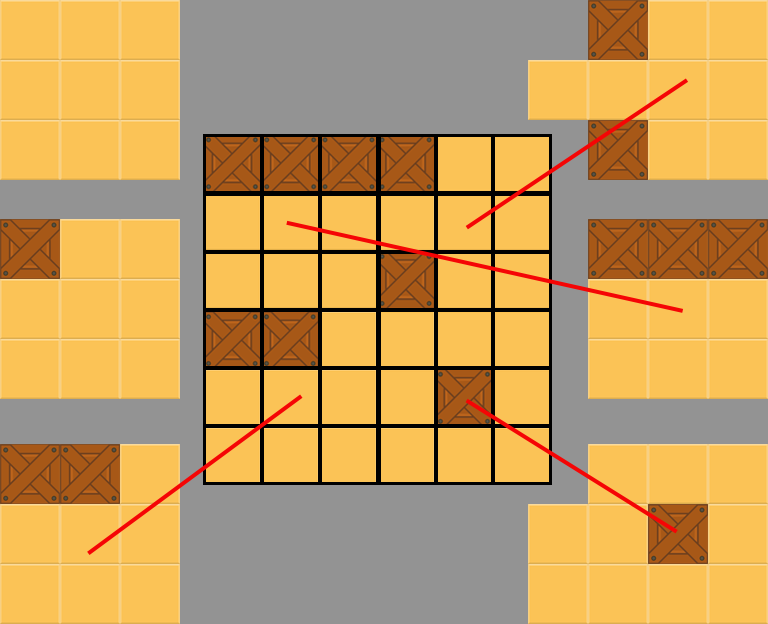
The first test is to make sure there is only one 'room'. Testing for one and only one continuous floor space. A player should be able to walk on every floor tile in each level. This is done by starting in the top left corner of the map and checking each tile to see if it is a floor or wall. If its a floor its marked and every floor tile connected to it is given the same mark. After checking each tile the marks are examined. If any two floor tiles have a different mark the level is rejected.
The next test checks to make sure there are no large floor spaces. A subset of tiles that are all floors larger than 3x4 are rejected. This is because these levels are very simple for humans to solve but greatly increase the time it takes for the computer to solve. This is done by starting in the top left corner and counting each floors tiles neighbors until a wall is reached it the count is large enough the map is rejected.
The last test checks for dead ends. Any map that has a floor tile surrounded by three walls is rejected. These trapped floors are thrown out because they really just waste space. They are too obvious to trick a player, but the ranking algorithms see them as a possible bad move and rank the level more difficult then they really are. This is done by counting the number of walls touching each floor tile, if a count gets higher that two the map is rejected.
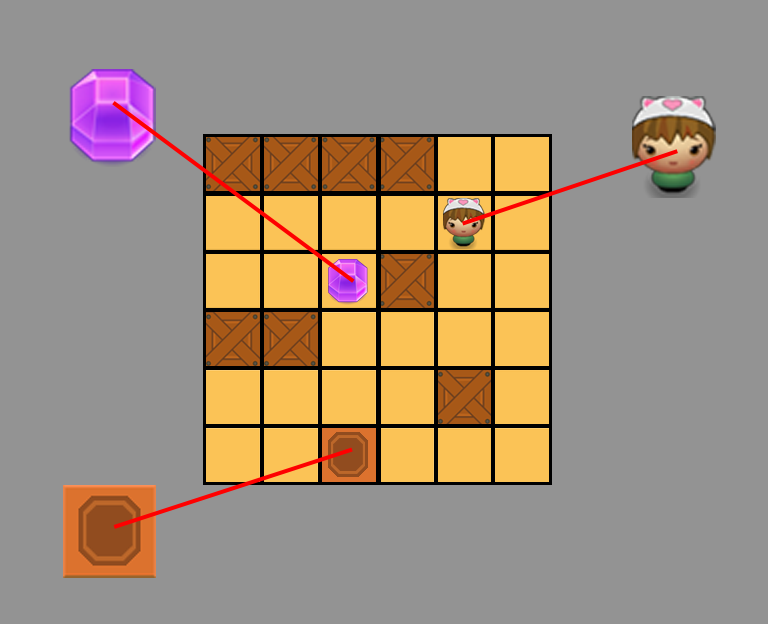
4. Place Players, Gems, and Goals
Once a valid map has been created the goal is to create as many possible levels from that map ranking each one so that the hardest from each category can be selected. First a player is randomly added on a floor tile. Next goals are added and then gems of equal number. The level is then passed to the solver to see if it is a valid level. Each level is added to a list to prevent repeats from being created. After the list is exhausted the number of objects is increased until every floor space has a goal, gem, or player on it.
5. Find the best solution to each level
Each iteration of a map will be ran through the solver. The solver will either output a solution string or 'No Solution'. A solution string is one of the optimal solutions by number of moves consisting of letter denoting direction of moves and whether that move is a push or not. Example: ddlUUUUruL would translate to move down, down, left, push up, push up, push up, push up, right, up, and push left.
6. Analyzing the Solution
Once the solver has found and returned a solution string, that string is analyzed. Moves, pushes, and boxline scores are all found by analyzing the solution string.
6.1 Moves
A count of the number of times the player must move to solve the puzzle. Any time a player moves from one tile to another, regardless of whether it is pushing a gem or not.
6.2 Pushes
A count of the number of times the player must push a gem to solve the puzzle.
6.3 Boxline
A count of the number of times the plater must push a gem in the same direction to solve the puzzle. As an example, if a player pushes a box 10 tiles down a hallway it would be counted as one boxline.
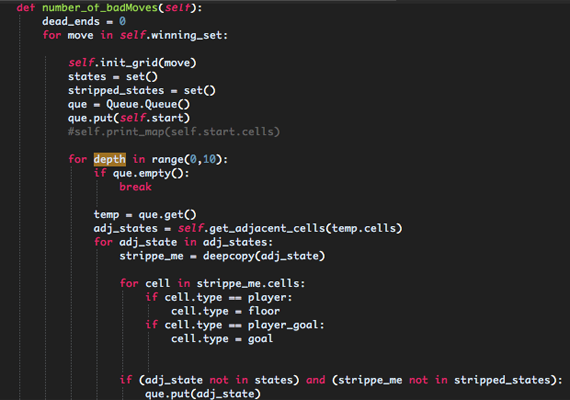
7. Counting the number of 'bad' moves
The goal of this ranking algorithm is to find the number of bad moves a player can make during a game. A bad move would result in loosing the level. Any move that results in the puzzle being unsolvable would be counted and applied to the resulting rank.
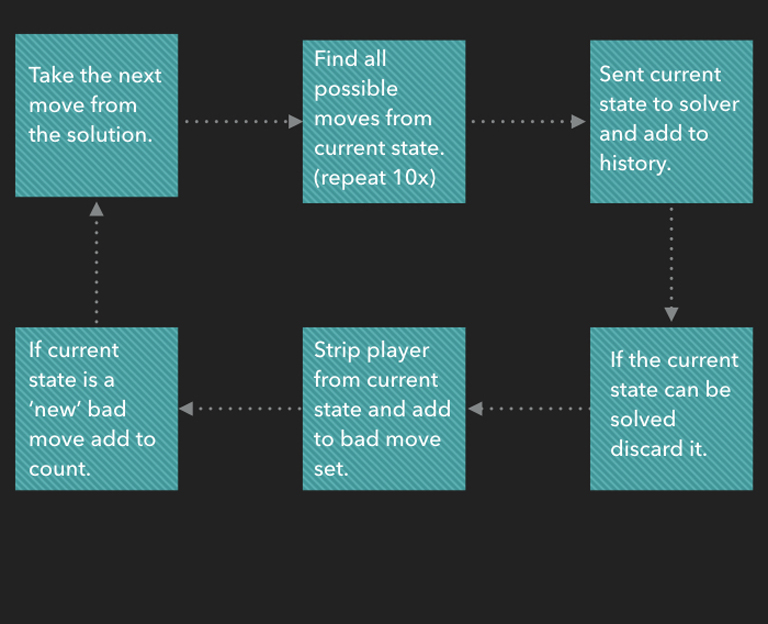
7.1 Following the solution path
To help count only bad moves that a player is likely to make, we follow the solution path and analyze all the possible moves from the solution path at each step. From those deviations from the solution path we take the next ten possible moves deep and check to see if any of those resulting moves kills a level.
7.2 Removing duplicate deadends
The ten moves deep from each solution step will result in visiting the same states many times. Imagine a upside down tree. The trunk is the solution path. A branch breaks of from the solution for each tile a player can move too from the trunk. Each of those branches splits into more branches for each tile a player can move too. We do this until each branch has 10 splits. By keeping track of all visited states we can trim the tree to make sure we only visit each state once while counting dead ends.
Once a player has created a dead end, for example pushing a gem into a corner, the game is not over at least from the view of the computer. Since the player is free to wonder around each tile the player could move too would result in a 'new' dead end, even though it really is just one bad move. To help correct for this once a dead end is found, a list of dead ends it kept with the player removed. This history removes counting of dead ends that have already been counted.
8. Scaling Ranks
Players are given the chance to rank a level on difficulty using the scale 1-10, with 1 being easy and 10 being hard. Since the number of move, push, boxlines, and dead ends could be much larger than 10 a scaling is need to allow for comparing each type of difficultly ranking.
A linear scaling is applied to the data for comparison. This equation takes the largest value and matches makes it 10 and the smallest becomes 1. All the rest of the data is fit properly between 1 and 10. This is not perfect because the it is possible that the system has not created a level with a true 10 difficulty, meaning that a level that should be an 8 is scaled to 10 until a more difficult level has been created. As the number of levels increases this error will heal itself or with more data a false 10 could be added to help with the scaling.
9. Graphs
The scatter plots show the correlation between each type of system assigned rank and the averaged player ranking. The idea is for the system to assign an exact match to player assigned ranks. This would result in a perfect diagonal line going from the bottom left corner to the top right corner. Overlapping dots are shown as only one dot in all the graphs.
10. Correlation Coeffiecent
The correlation coefficient (r value) is calculated for each graph. This number helps quantify how closely the data matches the ideal diagonal line. If all data points landed on the diagonal the correlation coefficient would be 1.0. The closer the r value is to 1.0 the better the system ranks match player ranks.
Code
code is hosted on bitbucket (repo)
Sokoban Bootcamp
here is how to play in 5 steps

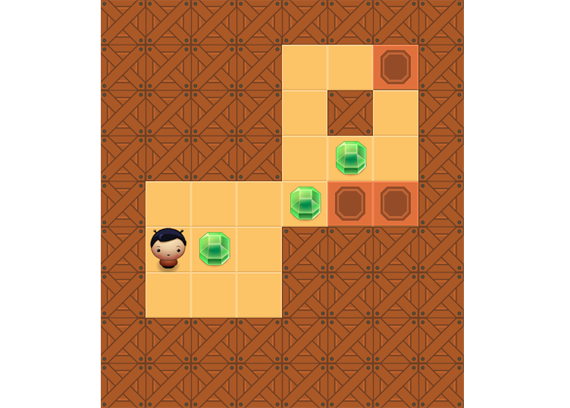
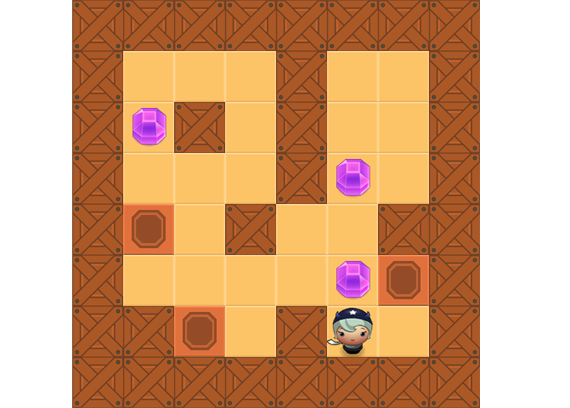
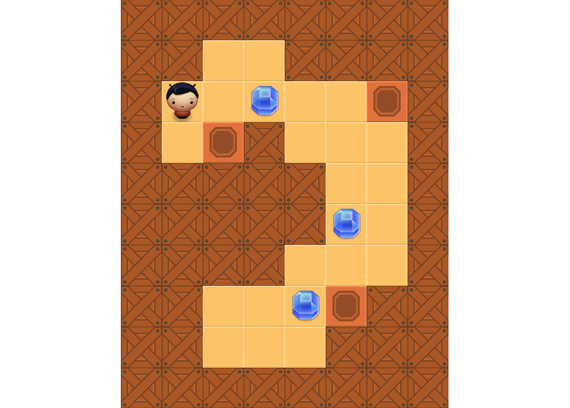
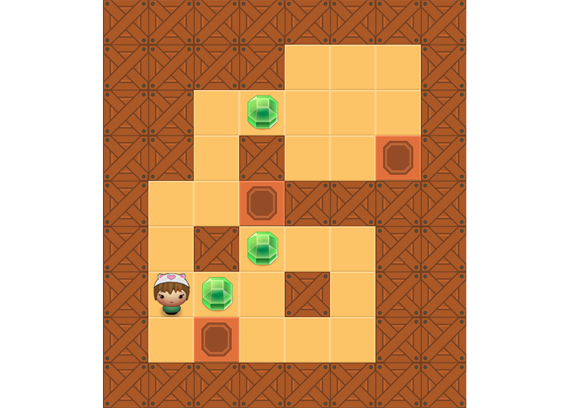
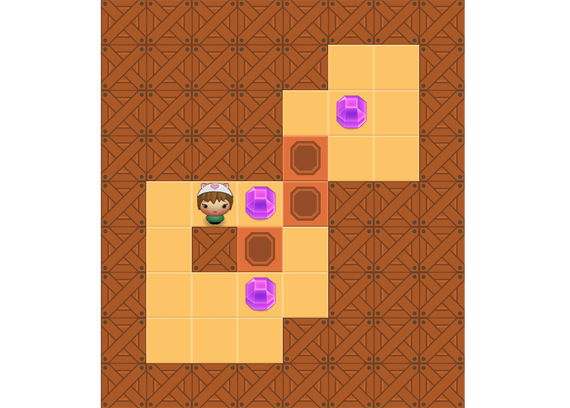
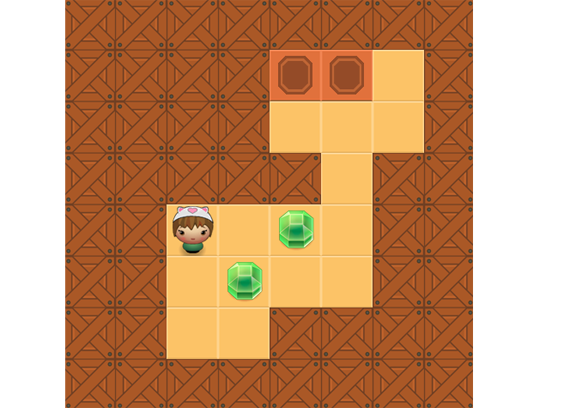
1. This is You

2. This is a Gem

3. This is a Goal

4. This is a Wall

5. Push all the gems onto goals, you can't walk through walls.
Play Sokoban
don't forget to rank each level
Results so Far
Each graph compares a type of difficulty ranking compared to player rank.
Y-axis is the system assigned ranking for each level.
X-axis is the player ranks for each level.
Each point represents at least one level plotted on System Rank by Player Rank.
Difficulty Rank by Bad Moves
This graph plots the ranking of each level by the number of bad moves a player is likely to make compared to the averaged player assigned rank.
Difficulty Rank by Moves
This graph plots the ranking of each level by the number of moves in takes to complete the level compared to the averaged player assigned rank.
Difficulty Rank by Pushes
This graph plots the ranking of each level by the number of pushes it takes to complete the level compared to the averaged player assigned rank.
Difficulty Rank by Box Lines
This graph plots the ranking of each level by the number of box lines it takes to complete the level compared to the averaged player assigned rank.
Props
Joshua Taylor and Ian Parberry wrote a paper on procedural sokoban level generation which influenced my level generator. I followed their first step of using templates to get a map created.
I found a python sokoban solver on rosettacode.org. Although I had to make serval changes to make it work for me, it started with their code.
Level Generation Theory & Sokoban Solver
(theory) & (solver)Props
Various pieces of the game art are from rad artist donating their art to developers, so rad! The walls are from Square Pug Games on opengameart.org. The players and gems are from lostgarden.com.
opengameart.org & lostgarden.com
(opengameart) & (lostgarden)Props
Absolutely amazing images are from unsplash.com. A 'do what ever you want' image site. Both background images are from unplash.com
unsplash.com
(website)Contact Me
feel free to contact me with questions, suggestions, complaints, and most importantly praise